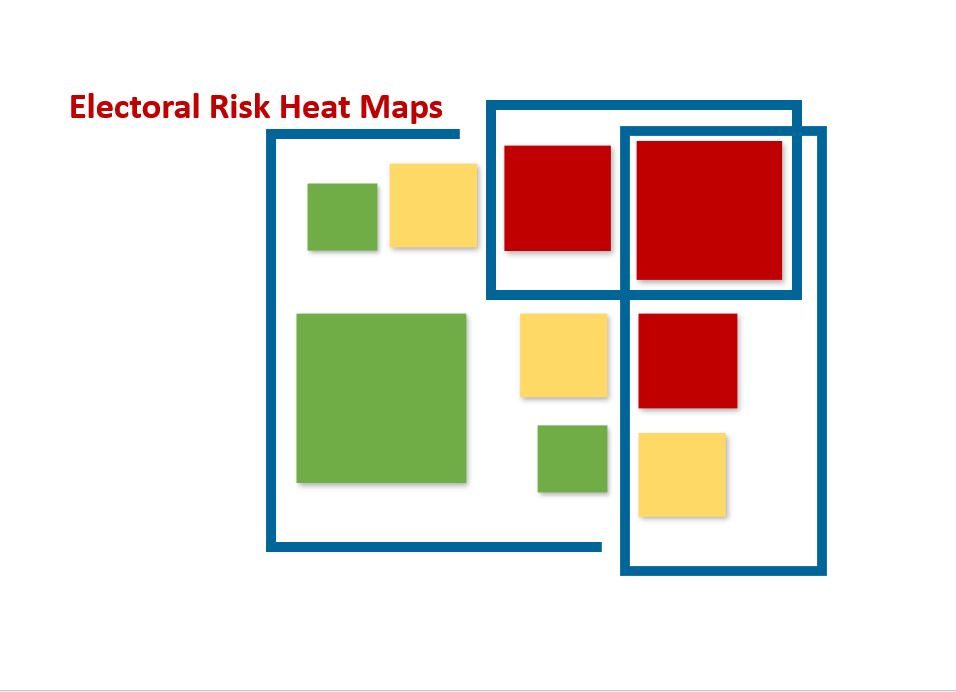
Electoral Risk Heat Maps: At the Intersection of Risk Management, Resilience-Building and Crisis Management
Risks are inherent features of any electoral process. To deal with them effectively, electoral management bodies (EMBs) are increasingly adopting formal risk management processes (International IDEA and AEC 2021, International IDEA 2023). However, institutionalization of risk management is complex. Risk management processes – typically including risk identification, assessment, analysis, communication, and treatment - can take different forms in different organizations. Most commonly, the risk management framework and policy are developed to detail the related responsibilities, resources, and capacity development within an organization.
Experiences from other sectors and a decade of International IDEA’s support to EMBs on this matter have taught us an important lesson. Adopting risk management is often an incremental process contingent on developing a risk management culture and using practical and collaborative tools (International IDEA 2016).
One such tool is a heat risk map. While there are numerous variations of the heat map, the idea is the same. The risk heat map has two axes. One axis reflects the increasing likelihood that the risk will materialize. The other represents the increasing severity of a negative impact when risk materializes. Each axis is divided into an ordinal scale, reflecting ratings of likelihood or impact. The space between axes is populated by boxes that form a risk matrix. Usual configurations are three-times-three (3x3, see Figure 1) or five-times-five (5x5, see Figure 2) tables.
|
Figure 1: Risk heat map 3x3
|
Figure 2: Risk heat map 5x5
|


Typical heat risk maps
The heat map used in Figure 1 allows assigning low, medium or high levels to risks, depending on where the likelihood and impact intersect. The map in Figure 2 is more complex and allows assigning numerical values to risks, ranging from 1-25 on an ordinal scale. International IDEA’s Guide on Risk Management for EMBs (International IDEA and AEC 2021) includes examples of electoral heat risk maps and related materials used by the EMBs of Australia, Canada and Kenya.
Heat risk maps have both strengths and weaknesses. In terms of strengths, they are practical for engaging non-risk experts, encouraging holistic thinking, and developing a shared understanding and sense of risks across an organization. The main concern includes subjectivity in assessing both likelihood and impact. However, these subjectivities may be minimized with methodological data collection and analysis that informs risk categorization and revision decisions.
More recently, International IDEA has developed and successfully tested a new concept whereby heat risk maps are used to support multi-stakeholder discussions to protect electoral integrity.
Use of Electoral Risk Heat Maps in the Protecting Elections Paradigm
In 2023, supported by the Canadian government, International IDEA commenced the Protecting Elections Project. The aim is to develop an Integrated Framework that promotes the increased use of risk management, resilience-building, and crisis management methods in elections.
In this respect, the International IDEA Discussion Paper on protecting elections (International IDEA 2023:12) notes that:
“Because risk management, resilience-building and crisis management often work towards the same goal, there are many overlaps between these methods in theory and practice. Therefore, it is not uncommon that organizations adopt one method, which then consumes elements of the other two. While such constructs may be logical and practical, they may also be constraining.”
Hence, the discussion paper delimited the three concepts by referring to their specific goals and offering an electoral analogy (see Table 1).
Table 1: Methods’ goals and electoral analogy

Source: Protecting Elections: Risk Management, Resilience-building and Crisis Management in Elections, International IDEA Discussion Paper 4/2023
Nonetheless, beyond arguing for a need to use these methods in a way that unlocks synergies between them, the paper did not elaborate on details.
The Protecting Election Project has taken this matter forward. One practical aspect is adapting the standard risk heat map to improve the understanding of overlaps and transitions between risk management, resilience-building, and crisis management practices.
The Protecting Elections Risk Heat Map (Figure 3) draws on Figure 1, but in this case, each box is numbered from one to nine (1-9, whereby numbers do not denote risk levels). Secondly, the map distinguishes three areas demarcating risk management, resilience-building and crisis management spaces of action.
Figure 3: Protecting Elections Risks Heat Map

Source: Developed by the author
The practical use of this model involves the following steps:
Risk identification entails listing possible negative occurrences. This should be the departure point of any effort to protect electoral integrity.
Risk classification entails assessing perceptions of individual risks’ likelihood and impact, linking them to specific boxes in the matrix, and assigning them corresponding numbers (1-9).
Decision on a course of action entails choosing an appropriate method for dealing with specific risks based on their classification.
Accordingly:
- All identified risks should remain a focus of the risk management process and be included in a Risk and Action Register. Consequent data collection and analysis will help make informed decisions about prevention and mitigation actions, including escalation or de-escalation of existing risks.
-
Risks categorized as eight (8) and nine (9) - combining high likelihood and moderate to severe impacts - should be escalated to resilience-building tracks. Organizations typically develop and exhibit resilience - defined as the capacity to withstand stresses and shocks from risks that materialize - by adopting one of the following strategies:
-
Resisting (doing things as planned, but often through strengthened/reinforced effort to deal with heightened stresses and shocks)
-
Adopting flexibility (plans are temporarily altered to deal with exceptional circumstances)
-
Transforming (how things are done is changed to account for new realities)
-
-
Risks categorized as three (3), six (6) and nine (9) - combining severe impacts and different likelihoods - should be escalated to the crisis management track. Crisis management is about developing plans for dealing with crises detailing preparedness, response, recovery and learning details.
-
When a risk is classified as nine, it requires escalation to both resilience-building and crisis-management processes.
There is a possibility that this exercise is done in circumstances when organizations already face threats or crises. It means that, in terms of likelihood, those situations will be outside the risk charts and require urgent action. However, in such instances, existing pressures may lead to resilience-building or crisis-management efforts that are less optimal. Therefore, it may be worth discussing if early identification and inclusion in a Risk and Action Register could have prevented adverse developments.
The Protecting Elections Risk Heat Map has thus far proven very helpful in International IDEA’s efforts to structure the conversation or organize workshops with national stakeholders on risk management, resilience-building and crisis management in elections. As we move forward, we will partner with several EMBs in testing and piloting new resources. Therefore, stay tuned for project updates to learn about developments and our other innovative tools.
About the authors